Sunday, February 3, 2013

Investigation 22.1: Crystallization and The Rock Cycle

I consolidated two investigations into one worksheet, since we had parted with the textbooks at this point in the unit.  I hoped that providing an interactive rock cycle experience would be more meaningful than reading a chapter out of the book, too!

Investigation 22.1 and the Rock Cycle

We were able to tie together our observations of the igneous rocks with an investigation on the growth of magnesium sulfate crystals at different rates.

A video is forthcoming for the investigation.

We also used some additional data on the first five rocks we examined during Investigation 21.1:

Igneous Rock Descriptions

The URL for the interactive rock cycle activity is printed in the worksheet.

We followed up our work on the Rock Cycle with a short quiz to test our understanding after spending two class periods with the worksheet and the interactive website.  Because we were at the end of the semester, this quiz could not be retaken – so I am posting it here for practice.  It predominantly focuses on the three types of rock: igneous rock, sedimentary rock, and metamorphic rock, and the ways each rock can be changed into the other.  There were also some basic questions about types of volcanoes and types of lava.

Quiz 6

Investigation 21.1: Observing Igneous Rock

Investigation 21.1 introduced us to the concept of igneous rock, which is rock formed by the cooling of magma or lava.  We examined different specimens and took observations onto a worksheet.  We started with two easy properties: color and texture. For texture, we focused on grain size within the rock.


After recording those two properties, we brainstormed as many different properties as we could that we could use to tell two rocks apart.  The winning table group in our little competition identified seven different properties, most of them being used by geologists every day in their field research.


I took photos of all the rocks we had in our kit – nine in total.  You are only responsible for taking observations on the first five, but you may find the others interesting.  They aren't going to be the same as examining them in person, but it may give you enough information to take some general observations for the next investigation.  I will provide some basic descriptions here as well.

You can click on any of the images to enlarge them.


Rock 1:  Basalt

Greenish-brown or gray in color, the rock has very small grains of varying but similar colors.


Rock 2:  Granite

Multi-colored with large grain sizes.  Colors from black to white to pink to brown were seen in this rock.


Rock 3:  Obsidian

Glassy, shiny black rock with sharp edges.  There were no grains visible at all.


Rock 4:  Gabbro

This rock was predominantly green and black  with brown and deep yellow colors mixed in.  The grains were large – perhaps larger than those in the granite sample.


Rock 5:  Rhyolite

This rock had mixed grain sizes ranging from large to very small.  The rock had varying colors from predominantly brown and tan to green and black.


Rock 6:  Pumice (floating)

This rock was very unique and fascinated most of the students.  It was very light, filled with pockets of air, rough to the touch, and brittle.  It had very small grains and was very light tan in color.


Rock 7:  Pumice (glassy)

This rock seemed very much like the pumice above, yet didn't have the air pockets and wasn't quite as light.  It seemed to have layers, but the grains ranged from small to medium.  The color was variable as well, compared to the floating pumice.  It seemed to have a lot of variety.


Rock 8:  Tuff

Very light, but not full of obvious air pockets like the pumice.  This had mixed grain sizes:  There were medium to small black grains that could be seen, very crystal-like, but the majority of the rock was a lighter tan grain size that was very small.

Rock 9:  Breccia

This rock had small to mixed grain sizes and samples had very different appearances: some were lighter in color, while others were darker.  There was also inconsistency in the grains, from their color to their size, although no really large grains.

Demo of Three Volcano Types with Hot Wax


This is a placeholder for video of this demo, using hot wax and sand to make all three types of volcanoes.

Magma and Lava Summary Worksheet


There was a general feeling that our investigations on magma and lava properties, and how they may affect the types of volcanoes formed and the types of eruptions that occur, seemed fairly confusing and not directly connected to what we were trying to learn.  Many students were confused.

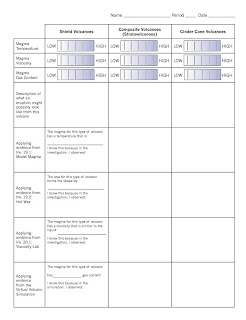
So I tried to create a graphic organizer that would help us organize our evidence from the recent investigations into three categories – based on the three volcano types.  It was still confusing to fill out, but in the end it helped us gather the information we needed to complete one of the checklist items for our Volcano Projects.

Volcano Type Summary Worksheet

Remember, we didn't collect evidence for every type of volcano from every investigation – some of the spots on the worksheet will remain blank!  Please ask if you have any questions.

Friday, January 18, 2013

Investigation 20.1: Viscosity and Volcano Type

Here is the video for the investigation on viscosity and volcano type:

Investigation 20.1

This video is longer than most – it clocks in at around 16 minutes.  But I think it is worth viewing, and will connect you to the activity in a way that most did not experience.  I ran through all of the types of liquids we were testing, but in class, each table group only tested two of the liquids, and at the end, we shared our results and filled out our tables.  In this video, you will be able to view the liquids flowing down the wax paper, take your own observational notes, and record times that I tracked in the video.

Make sure to stick around for the end of the video, when I tie the investigation to the reading that we did on Volcano Types (pages 229-231).  In the followup session, we compared our results and our conclusions about the viscosity to the types of volcanoes that these liquids might form (if they were lava).

Remember, viscosity is a characteristic of liquids.  It is the tendency of a liquid to resist flow. I have said in class that it helps to replace the word viscosity with the word thickness to help determine its meaning within a sentence, but it is important to mention that they are not the same thing.  They may often be directly related, but we must be careful to remember that viscosity does not mean thickness. This activity may help you with this concept!

Investigation 19.2: Lava and New Landforms

Here is the video for this investigation, in which we used melted wax to model the behavior of lava in the process of moving and cooling:

Investigation 19.2

The procedure begins on page 217, and you should be prepared to take observational notes before watching the video, which is about 10 minutes in length.

Answer Reflection Questions 1, parts A-C and Question 2, part A on page 219 and turn it in with your observation notes for credit on the assignment.

Volcano Project


Here is a link to the assignment sheet for our Volcano Project:

Volcano Project

Remember, each student was assigned a specific volcano.  You must do your Project on your volcano!  If you do not remember your volcano, we have a master list in the classroom.

The Project is due on Monday, January 28th.  If you turn it in after this date, there is no guarantee that we will have it graded in time for you to receive credit by the end of the semester!

Please ask us if you have any questions – and we hope you enjoy researching your personal volcano!

Investigation 19.1: Magma and New Landforms


Here is a video of the investigation we did using Model Magma and soil:


You should read through the procedure starting on page 211 before watching the video, and you should take observational notes as you watch this short investigation if you did not receive the worksheet.

Answer Reflection Question 1, parts A-E on page 214 and turn it in with your observation notes for credit on the assignment.

Remember, we are using a model to represent something in the real world. Think about this as you watch the video.

Make sure to ask us any questions you may have about this investigation!

Vocabulary 18, 19, 20


Here are the vocabulary worksheets that we have done so far in the volcanoes unit.  There will be at least one more!


Beginning our Study of Volcanoes: Video and Readings


We started our unit on volcanoes by watching an episode of NOVA titled Doomsday Volcanoes.  The episode is available to stream online:


It is well worth an hour of your time!  It covers the volcanoes in Iceland that have erupted recently or that scientists worry could erupt at any time.  It gave us a good introduction to the impact that volcanoes have on the entire world!

We have done several readings from the textbook during this first week.  They are listed below, and remember – not only is the textbook available as a PDF here, but I have provided audio podcasts as well.

Volcanoes: Help or Hindrance?
Pages 206-209
Assignment:  Make a T-chart labelled "Help" and "Hindrance", and take notes from the reading on how volcanoes can be both.  This was considered part of the Vocabulary 18 assignment.

An Island Is Born
Page 221
Assignment:  Take notes in your science journal.

Volcano Types
Pages 229-231
Assignment:  Take notes in your science journal.  This reading is linked to Investigation 20.1, and the details on the three major types of volcanoes will not only be helpful for your Volcano Project, but will also be on a future quiz!

Sunday, January 13, 2013

Wrapping up Earthquakes by Constructing an Explanation

Before break, we started working as a whole group to construct a complete, gapless explanation for what causes earthquakes.  Through all of our activities and investigations, we have gathered enough evidence to be able to explain why earthquakes happen.

But it was a big task, so we split the class into three teams, each taking one part of the explanation.  We worked on constructing each piece of the explanation with some goals:

  • To make sure we met each of three important concepts provided on a "gotta-have" checklist
  • To back up each claim we made with evidence that we gathered over the course of the unit
  • To make sure everyone understood the explanation and could explain our part of it

We used the following sheet to help organize our claims and evidence:

Explanation Worksheet

We then came together as a large group and shared each piece of the explanation.  By doing this, we hoped to all have the entire explanation, while only having to do some of the work.  However, it was challenging to work in such large groups, and it was difficult to write down everything that was said during the presentations.

So when we returned from break, we took a day to coordinate and share information.  We worked in small groups, each group with one person from each part of the explanation, to make sure that everyone had a chance to write down the claims and evidence on their worksheets.  Our final quiz on earthquakes involved providing an explanation, and we were allowed to use the Explanation Worksheet as notes on the quiz.

After the quiz, we used our Explanation Worksheets to try to explain why the Kobe and Nisqually quakes were so different in their intensities yet so similar in their magnitude.  Many groups were able to provide different factors that made the quakes different, backing up their claims with evidence from our worksheets.

Monday, December 17, 2012

Vocabulary 15

If you were one of the many students who missed class on Monday, you might be interested in having access to the vocabulary activity, as everyone will be responsible for completing it on their own.  You can print the first page of the grid as your handout.

Vocabulary 15

In addition to completing the grid, we had everyone draw pictures representing the definitions for all five of the words on the back of their handouts.  As with our Pictionary game on the whiteboards last week, the only rule is: no words!

If you are looking for a good practice activity to help you study the vocabulary, I also gave some students who finished early the challenge of writing about what we have learned so far in the earthquakes unit – trying to use all of our vocabulary words so far!  I am not sure anyone was able to do it in the five or ten minutes available!

Investigation 16: Convection in the Mantle

On Friday of last week, we looked at a special fluid that reacts to heat, and used it as a model for the interior of the Earth.  Here is the handout for this activity:

Investigation 16

We used the fluid to help explain why plates move, and how the mantle is connected to earthquakes.  If you were not able to attend, please arrange to come in during lunch to see it; it's worth the time!

If you did not get a chance to see this investigation in person, I made an attempt to film it.  Here is a link to the YouTube video, but it is not as easy to see the convection currents.

Investigation 16: Convection of the Mantle

After we finished the investigation, I presented evidence to help us include soil types in our explanations of our two earthquakes.  I presented small pieces of the geological maps from the area surrounding Kobe, as well as a clip from a report that identified the landfill areas around Kobe's ports as being responsible for the large incidents of liquefaction.  I showed this quake intensity map, which shows a string of high intensity right around the port area of Kobe.

I then showed the geological data for downtown Seattle, which is largely manmade fill and leveling.  I talked about a report that I found that discussed the many examples of liquefaction near our ports, and a mention of a strange phenomenon called "sand boils."

I then finished with the geological data for Orca's neighborhood.  Most of Orca sits on glacial till or bedrock.  The bedrock would help explain why Orca could be closer to the epicenter of the Nisqually quake, but experienced a lower intensity than Pioneer Square downtown.

I will try to share these map clips on the blog, but the geological maps are available for free online through the USGS website, and the reports are also easily found with Google.

Readings on Plate Tectonics


Last week, we spent some time during class reading about the interactions that happen between plates at their boundaries.  We read through Chapters 1 and 2 in an interactive ebook available in iTunes U.  If you have iTunes, you can access this entire book for free:

California Academy of Sciences: Earthquake

The chapters are relatively short, and have short videos and interactive graphics that help with the learning process.  We took notes and drew diagrams representing the three major plate boundary interactions that we found near the end of Chapter 1.  We also read about Pangaea and Plate Tectonics in Chapter 2, where we learned that all of our continents were at one point connected in one large land mass hundreds of millions of years ago.

Here is a study guide that was handed out during class to help with this reading.

Sunday, December 16, 2012

How does an earthquake create both P-waves and S-waves?

After Investigation 11.1, I searched for a way to clear up the question over how an earthquake can create both P-waves and S-waves.  I was coming up short, until my friend and fellow student teacher, Ms. Yip, offered me a suggestion that worked out perfectly.  Most of you saw me demo this at the beginning of class last Friday.

For those who were not able to see the demonstration, here is a link to the video I recorded:

Investigation 11.1 Extra: Creating Both P-Waves & S-Waves

In a nutshell, I created a P-wave using an "earthquake wave simulation spring", as Ms. Katherine calls them.  But I also had a spring set up 90º perpendicular to the first spring.  I then held the ends of both springs in my hand, and moved them together while I created the P-wave.  This created an S-wave on the second spring – it's really best if you take a few minutes to watch the video, because I think it does a great job of demonstrating this.

It's most important to remember that earthquake energy goes out from the focus in every direction, much like an explosion.  As a result, for every P-wave, there is an S-wave generated 90º in both directions.  Since the waves go out in every direction, there's going to be an S-wave generated that happens to line up with every P-wave.  I can't think of a better way to describe this, other than to remind everyone that the waves aren't going out in lines, but in spheres.  Think about Investigation 15.1: the waves we saw were not straight lines.

Please let me know if you have any questions!

Wednesday, December 12, 2012

Investigation 15.1: Using a Simple Model of Plate Movement

Here is the handout for this investigation:

Investigation 15.1

You may have noticed that we skipped Lesson 13 – we will be coming back to it shortly.  I moved the order around slightly because I felt it made more sense in our efforts to build our evidence about earthquakes.

On Tuesday, we did Investigation 15.1, in which we used some foam pads as models for the different plates that make up the Earth's crust.  You can review the procedure in Lesson 15 of the text, where there are diagrams of the pads and what we did with them.  Here is a link to the YouTube video of this investigation.  It is about six minutes long.

Investigation 15.1: Using a Simple Model of Plate Movement

We used the pads as models to study the three major plate boundary interactions that concern our research into earthquakes.  I am representing just two of the interactions we model with this investigation.  There are others, but this should help you start to think about how the pads help us visualize what is happening at certain plate boundaries.


Monday, December 10, 2012

Soil Types and the Effect on Intensity

I noticed while reviewing Quiz 3 that many students were still puzzled by the effects of the Nisqually quake regarding the relationship between distance from the epicenter and intensity.  We expect that as distance increases, intensity will decrease.  We can use sound waves as a good example of this: We expect that a sound will lose energy as it moves away from the source.  A blaring stereo will sound very loud right up close, but a block down the street, it will seem quieter.  This is easy to imagine.

But with the Nisqually quake, we saw more damage in downtown Seattle than we did in Tukwila.  And Tukwila is much closer to the epicenter of the earthquake.  How could that be?

We have to remember to take into account soil type and its effects on the intensity of an earthquake.  You can review this on page 132 in Lesson 11's reading.  I also created a small worksheet that we did in class to remind everyone how the soil type can change the relationship between distance from the epicenter and intensity.  If you would like to review the worksheet, I have it linked here:

Worksheet on Soil Types

I am working on an excerpt from the USGS geological maps of downtown Seattle, of Olympia, and of Tukwila – as well as the area around our school! – so that we may take a closer look at the soil types in each location.  I hope to post that soon.

Investigation 14.1: Using Waves to Study the Earth's Interior

For this investigation, we accessed Flash movies on the iBooks and used them as simulations of earthquake events, sending P-waves and S-waves through the interior of model planets.  We added to our knowledge of P-waves and S-waves, learning that S-waves do not travel through liquids. All of our knowledge on earthquake waves, we inferred how the interior of each model planet was arranged.

We used the following worksheet to play through the simulations:

Investigation 14.1 Worksheet

For each simulation, we sketched out the waves and what we thought the interior of the model planet looked like.

Here are the simulations that we used during the investigation.  They should open in a new web browser window.  You will need Adobe Flash Player installed to see them.

Simulation 1
Simulation 2
Simulation 3
Simulation 4
Simulation 5
Simulation 6
Simulation 7

In addition to the above simulations, I found the following interactive simulation a great way to review earthquake waves, and to see how S-waves can also travel as surface waves, and how destructive they can be.

Seismic Wave Motion Simulation

I hope you find this useful!

Investigation 12.1: Recording Earthquake Waves

In this activity, we used wooden model seismographs to record different types of earthquake waves, and examined how different factors affected the seismograms.

I recorded a Youtube video of the investigation:

Investigation 12.1 Video

In the video, I provide pictures of the actual seismograms I generated while recording the investigation. Feel free to pause the video to get a better look at the detail.

Here is the handout for the investigation:

Investigation 12.1

Sunday, November 25, 2012

Lesson 11: Designing Earthquake-Resistant Buildings

I have posted the podcast for pages 130-133, about Designing Earthquake-Resistant Buildings.  We will be reading this during class on Monday, November 26.

Podcast for Lesson 11, Pages 130-133