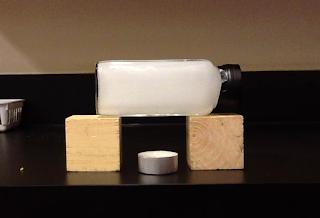
 On Friday of last week, we looked at a special fluid that reacts to heat, and used it as a model for the interior of the Earth. Here is the handout for this activity:
Investigation 16
We used the fluid to help explain why plates move, and how the mantle is connected to earthquakes. If you were not able to attend, please arrange to come in during lunch to see it; it's worth the time!
If you did not get a chance to see this investigation in person, I made an attempt to film it. Here is a link to the YouTube video, but it is not as easy to see the convection currents.
Investigation 16: Convection of the Mantle
After we finished the investigation, I presented evidence to help us include soil types in our explanations of our two earthquakes. I presented small pieces of the geological maps from the area surrounding Kobe, as well as a clip from a report that identified the landfill areas around Kobe's ports as being responsible for the large incidents of liquefaction. I showed this quake intensity map, which shows a string of high intensity right around the port area of Kobe.
I then showed the geological data for downtown Seattle, which is largely manmade fill and leveling. I talked about a report that I found that discussed the many examples of liquefaction near our ports, and a mention of a strange phenomenon called "sand boils."
I then finished with the geological data for Orca's neighborhood. Most of Orca sits on glacial till or bedrock. The bedrock would help explain why Orca could be closer to the epicenter of the Nisqually quake, but experienced a lower intensity than Pioneer Square downtown.
I will try to share these map clips on the blog, but the geological maps are available for free online through the USGS website, and the reports are also easily found with Google.